Debugging and Inspection
By default CacheProvider includes the DevToolsManager,
which means in development mode (process.env.NODE_ENV !== 'production') it will send state and actions
to Redux DevTools.
Getting Started
Install browser extension
Add the browser extension for chrome extension or firefox extension
Ensure Manager is installed
By default this is enabled in dev mode. If using your own set of managers, add DevToolsManager to the beginning of the list.
Open dev tools
After installing and running your site, a new icon should appear in your location bar

Clicking that will open the inspector, which allows you to observe dispatched actions, their effect on the cache state as well as current cache state.
Understanding Rest Hooks Cache
Rest Hooks uses the flux architecture to make it easy to understand and debug. This also has the benefit of making Rest Hooks concurrent mode compatible.
The same core principals of redux apply to this store's design.
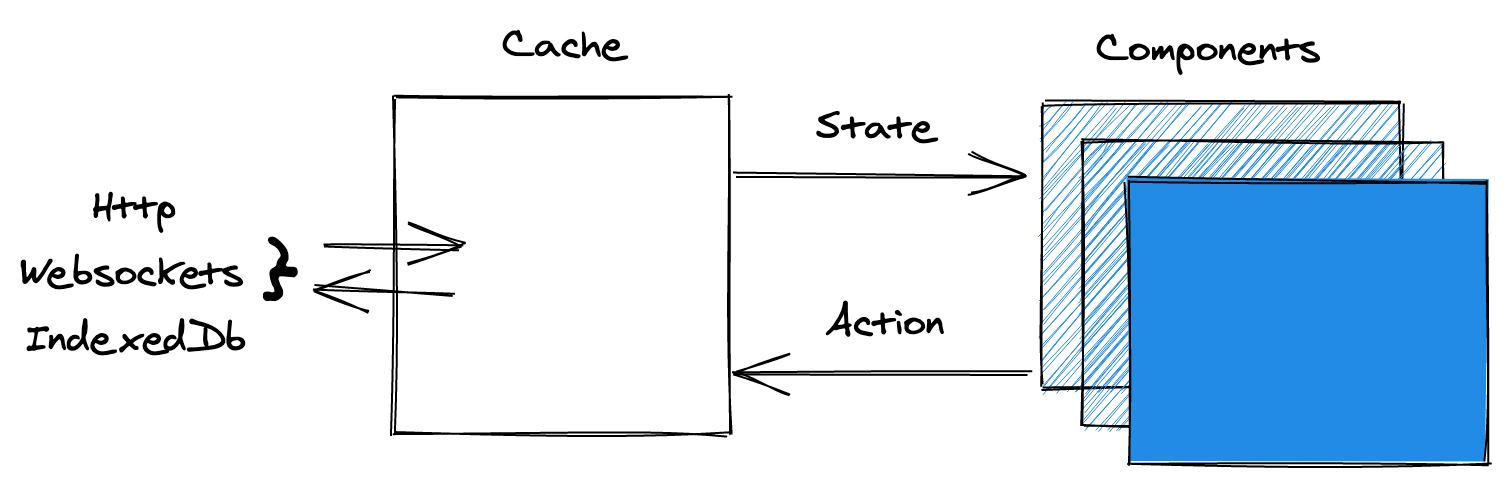
Here we see the data flow.
For example, when a useResource() hook is first mounted it might
- Start by dispatching a fetch action
- If no identical fetches are in-flight, the central store will then start the network call over HTTP
- When the network call resolves, a receive action is sent to the store's reducer, updating the state.
- The component is re-rendered with the updated state, resolving the suspense.
Normalized Cache
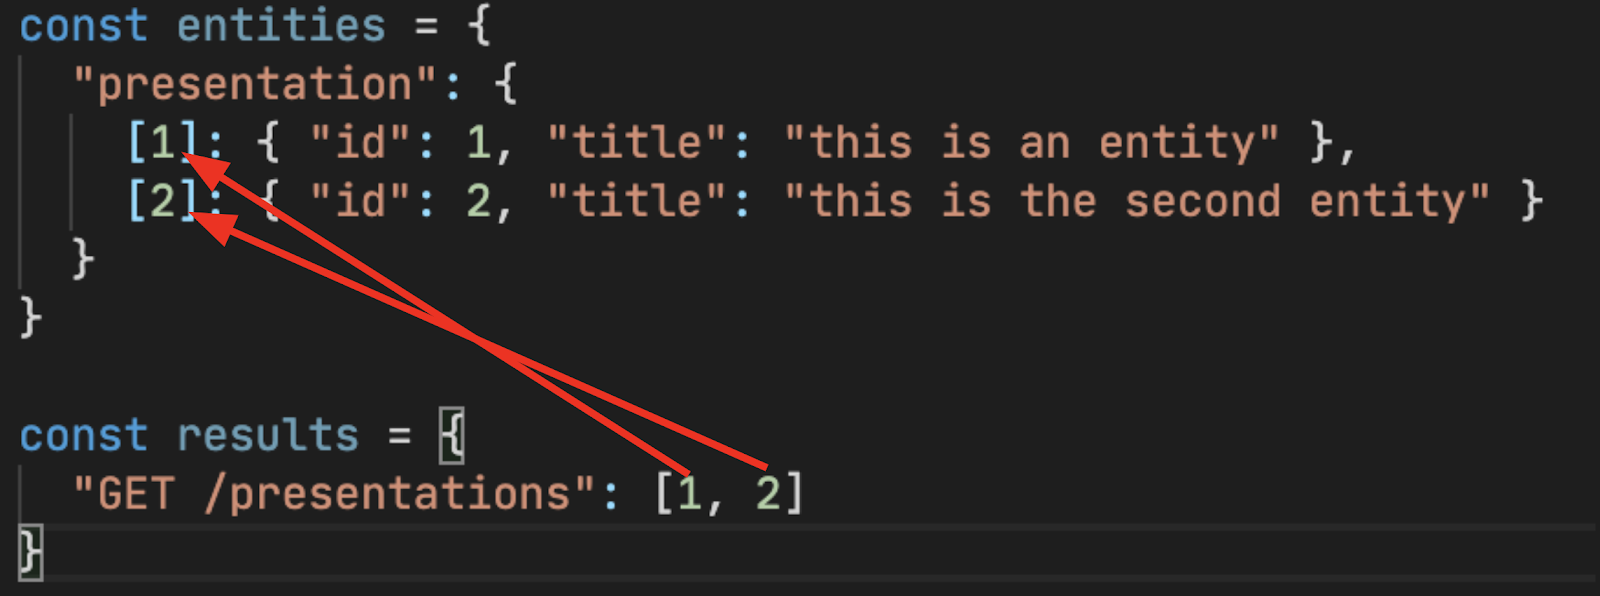
If schemas are used, API responses are split into two pieces - entities, and results. This ensures consistency and alows allows for automatic as well as novel performances optimizations, especially key if the data ever changes or is repeated.
- State
- Response
- Endpoint
- Entity
[
  {"id": 1, "title": "this is an entity"},
  {"id": 2, "title": "this is the second entity"}
]
const PresentationList = new Endpoint(
  () => fetch(`/presentations`).then(res => res.json()),
  { schema: [PresentationEntity] },
);
class PresentationEntity extends Entity {
  readonly id: string = '';
  readonly title: string = '';

  pk() {
    return this.id;
  }
}
export function PresentationsPage() {
  const presentation = useResource(PresentationList, {});
  return presentation.map(presentation => (
    <div key={presentation.pk()}>{presentation.title}</div>
  ));
}
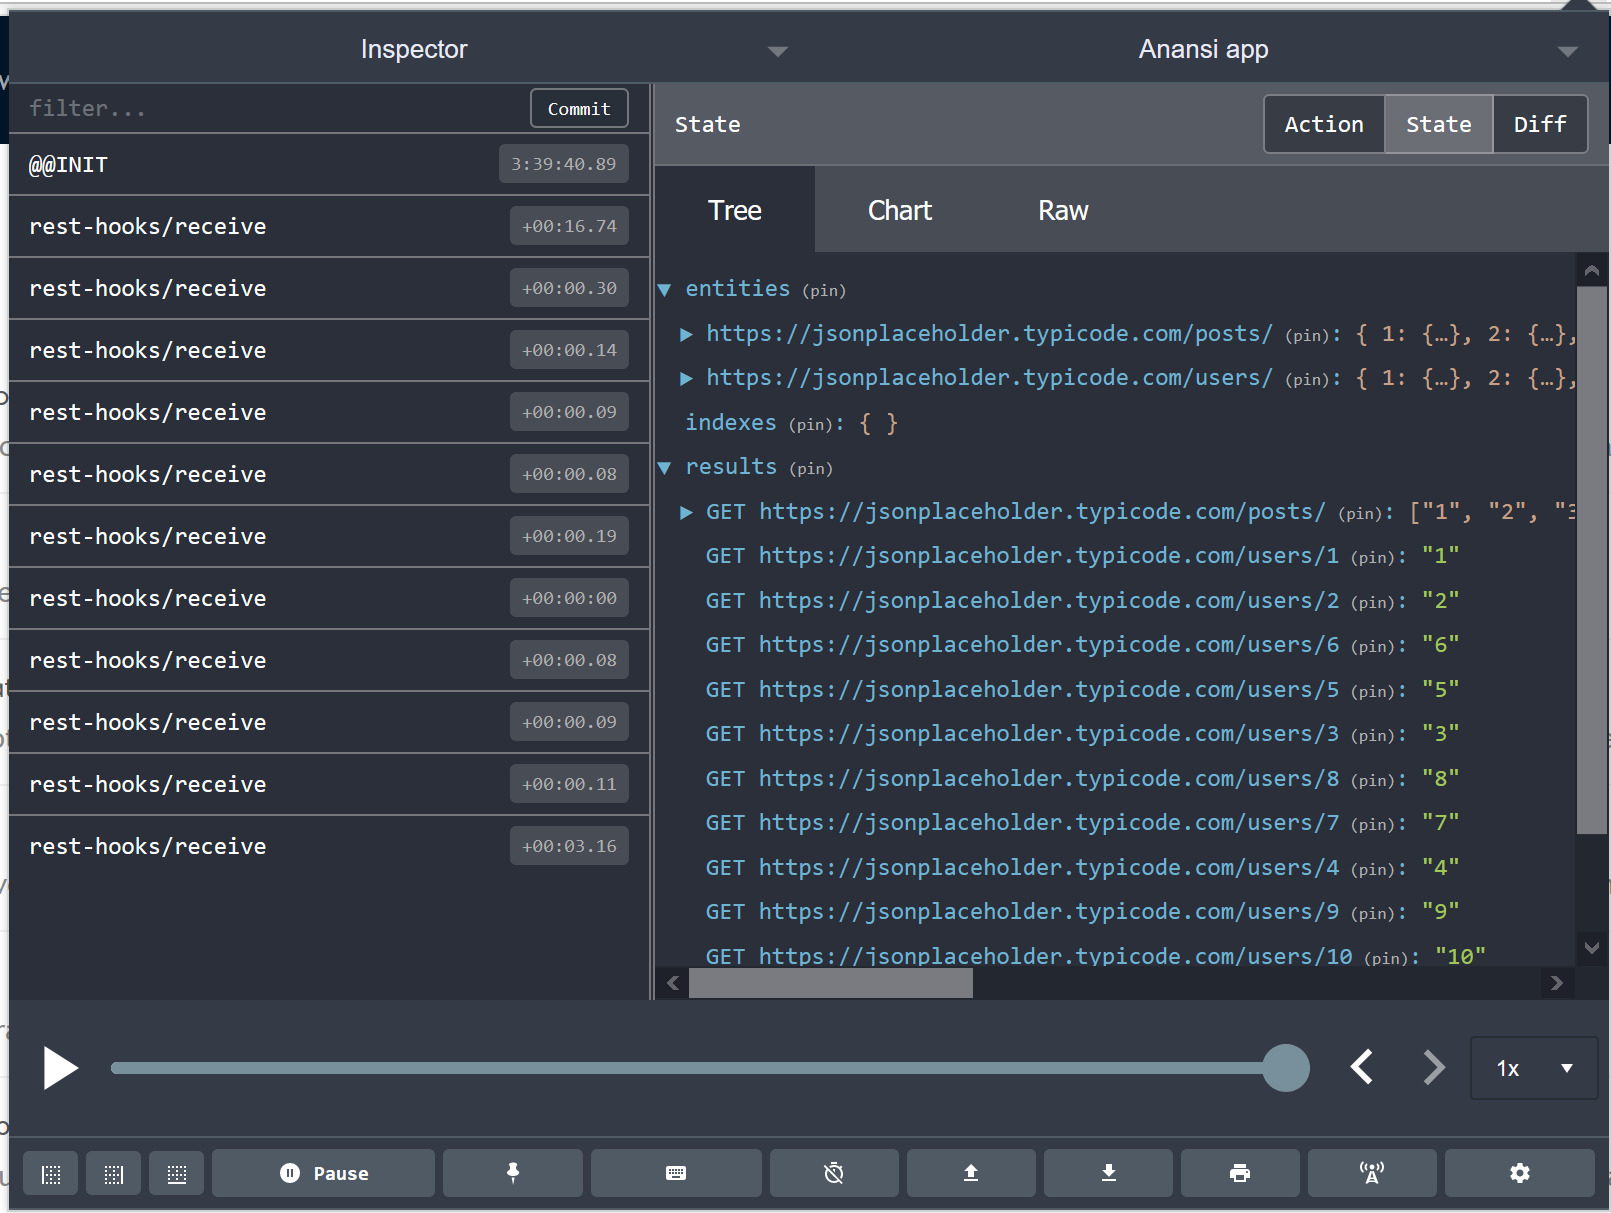
Once normalized, these entities and results are merged with the larger cache. Click on the 'state' tab in devtools to see the entire state. This can be useful to determine exactly where data is. There is also a 'meta' section of the cache for information like when the request took place (useful for TTL).
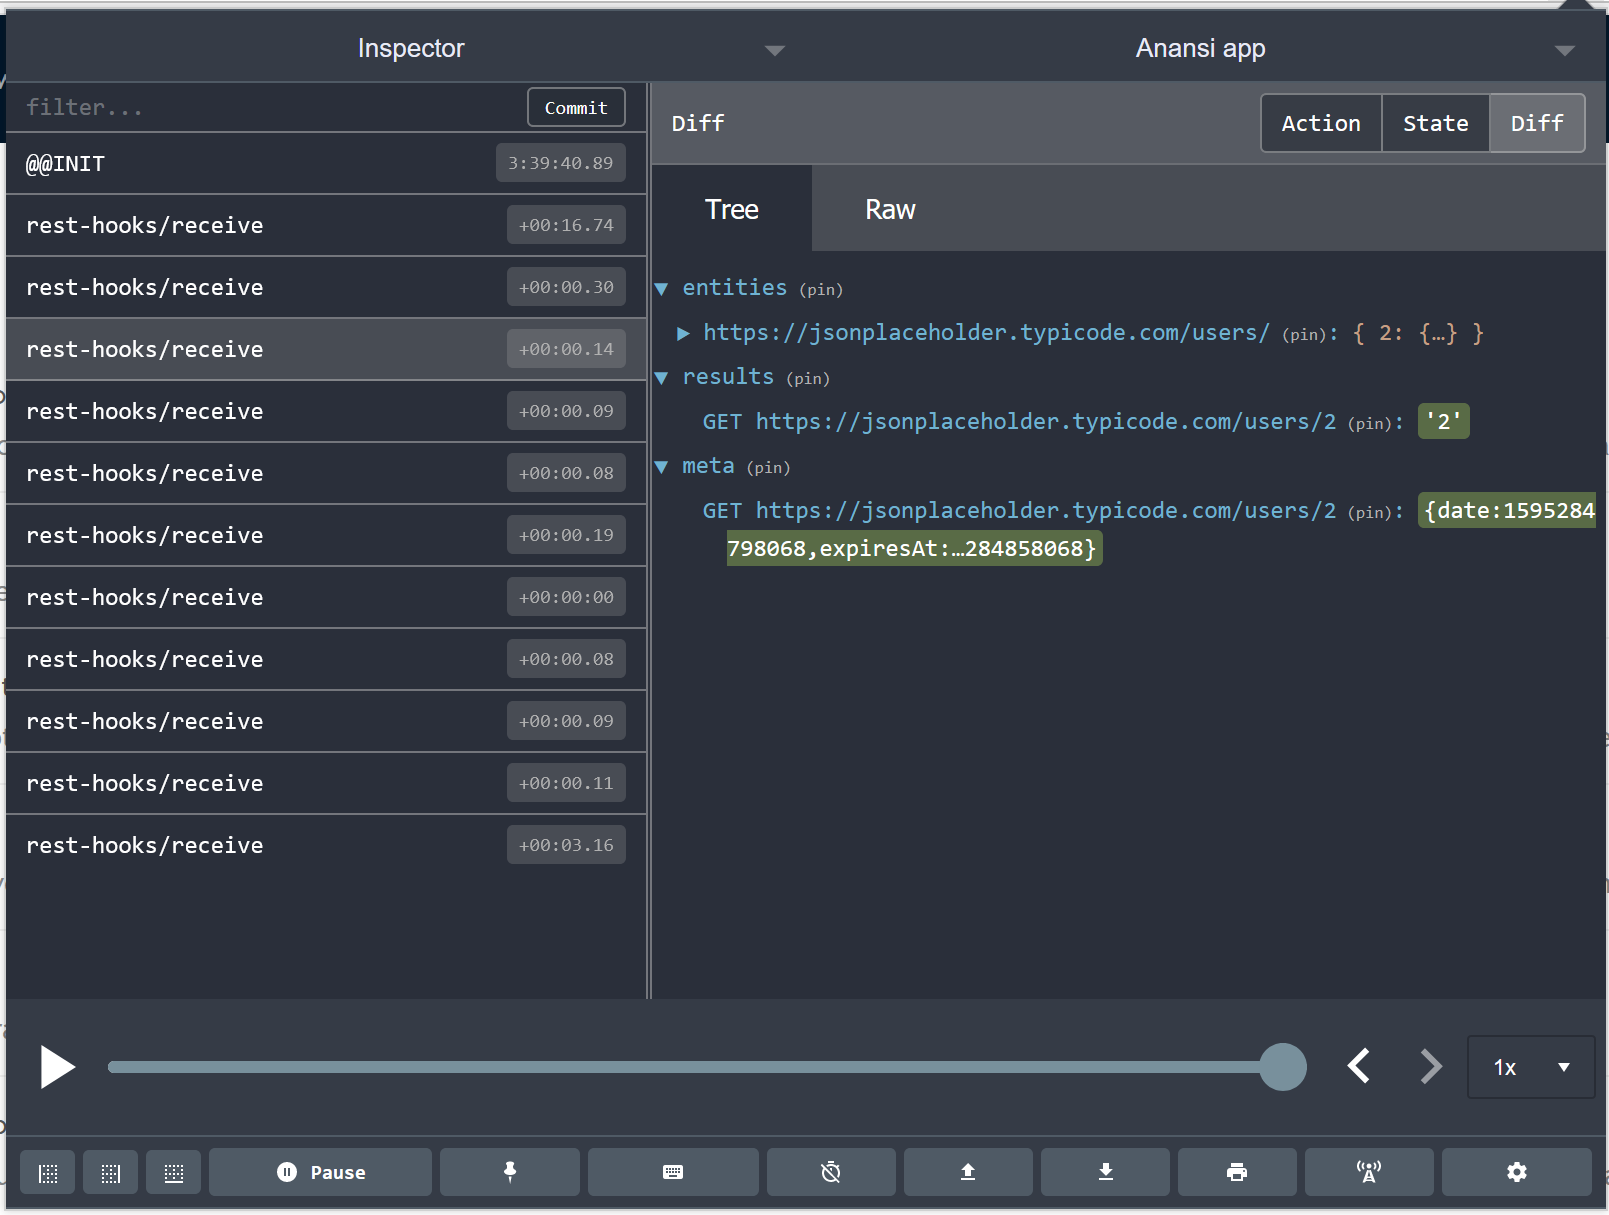
For monitoring a particular fetch response, it might be more useful to see how the cache state updates. Click on the 'Diff' tab to see what changed.
Here we can see that an entity was inserted as well as new results.